An update on America’s changing religious landscape
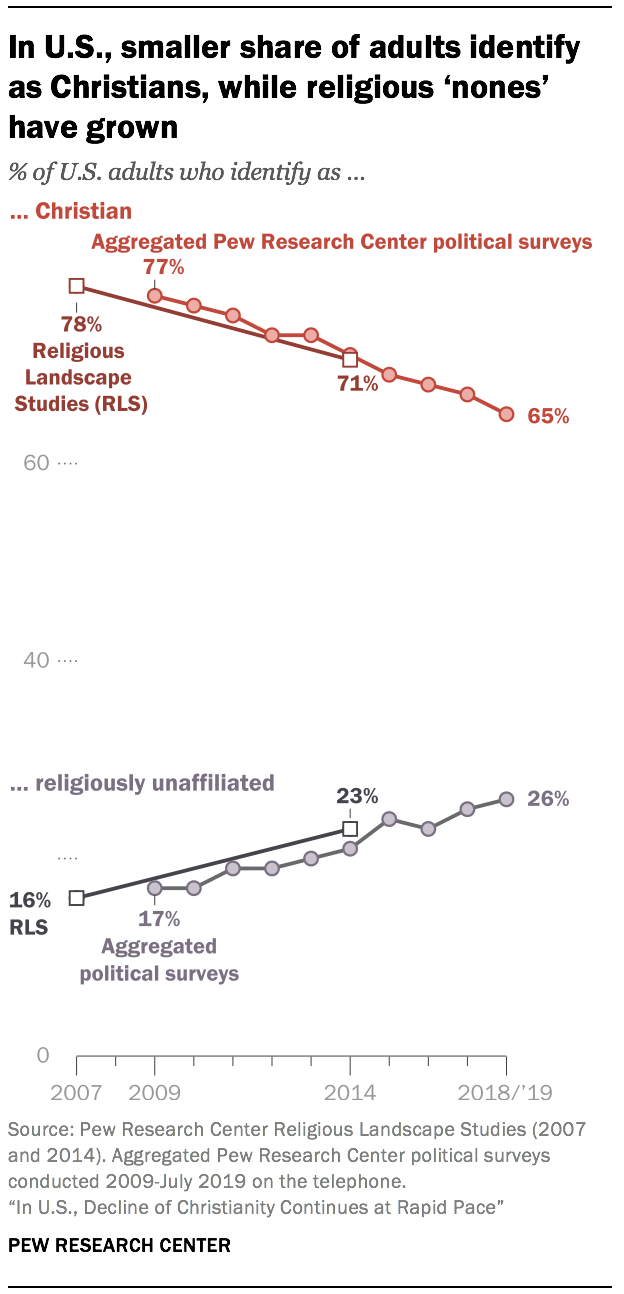
The religious landscape of the United States continues to change at a rapid clip. In Pew Research Center telephone surveys conducted in 2018 and 2019, 65% of American adults describe themselves as Christians when asked about their religion, down 12 percentage points over the past decade. Meanwhile, the religiously unaffiliated share of the population, consisting of people who describe their religious identity as atheist, agnostic or “nothing in particular,” now stands at 26%, up from 17% in 2009.
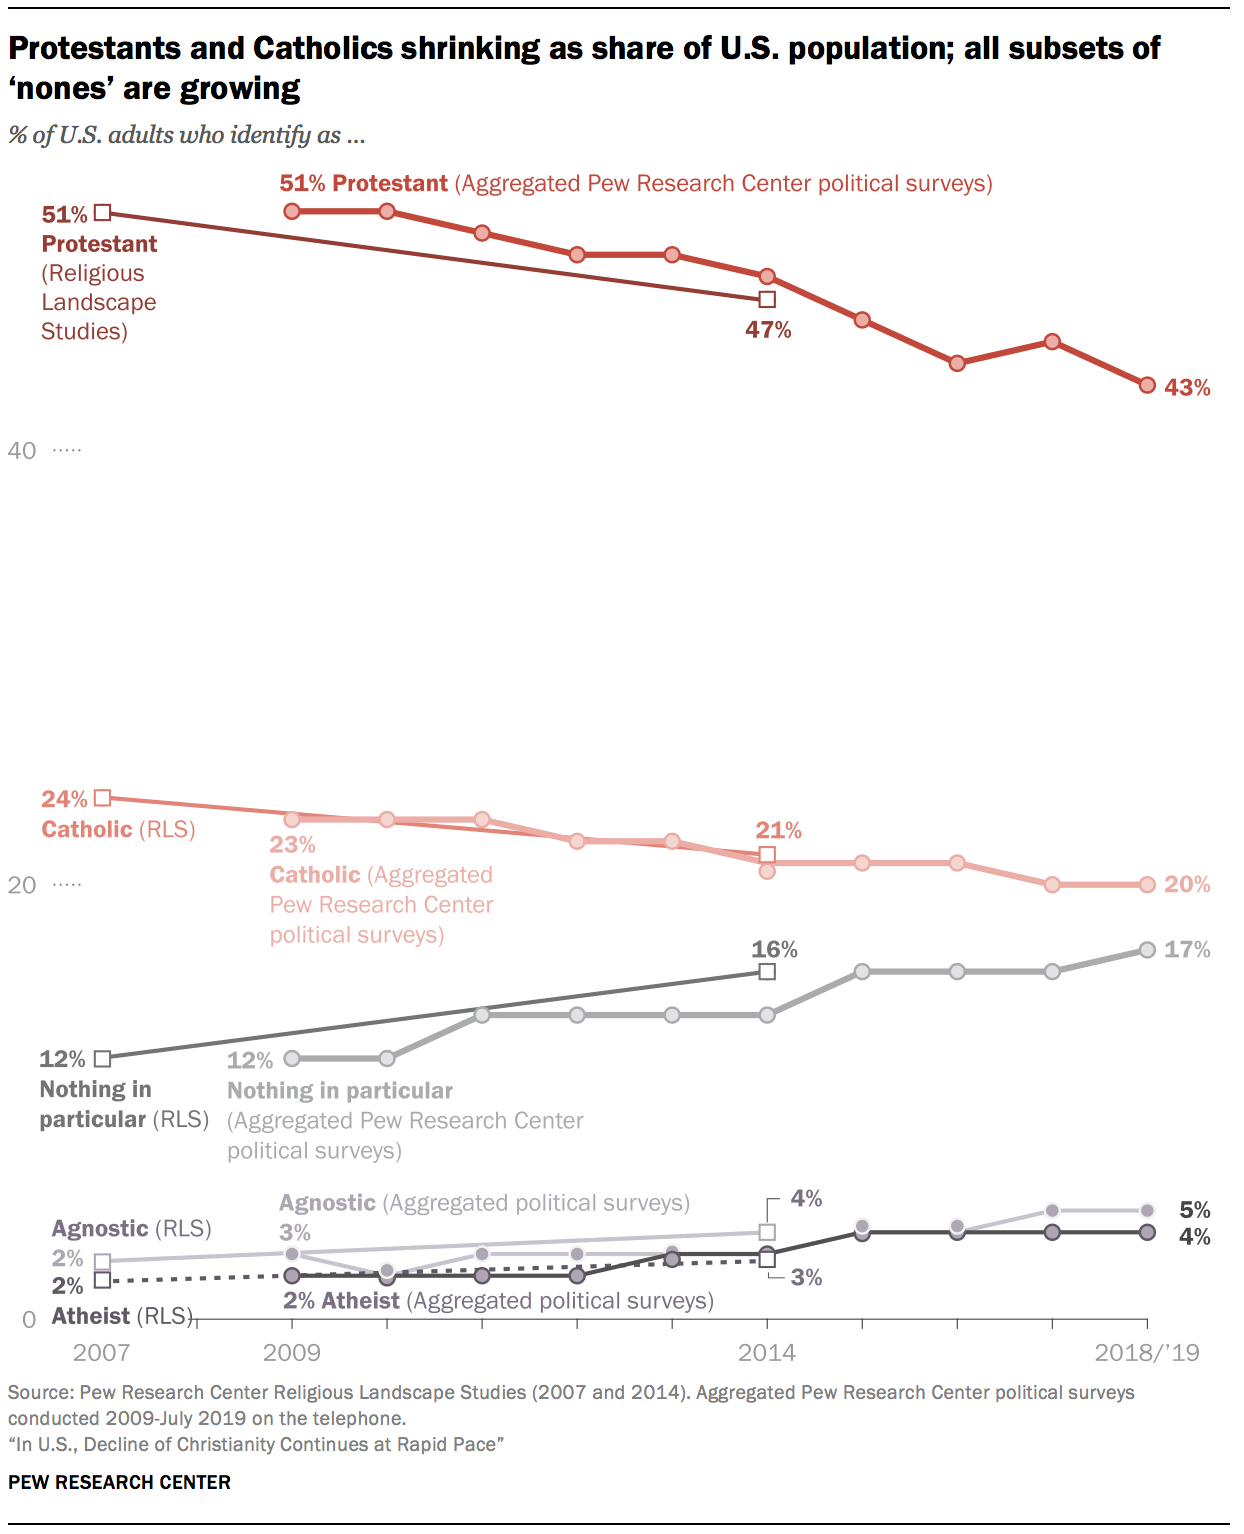
Both Protestantism and Catholicism are experiencing losses of population share. Currently, 43% of U.S. adults identify with Protestantism, down from 51% in 2009. And one-in-five adults (20%) are Catholic, down from 23% in 2009. Meanwhile, all subsets of the religiously unaffiliated population – a group also known as religious “nones” – have seen their numbers swell. Self-described atheists now account for 4% of U.S. adults, up modestly but significantly from 2% in 2009; agnostics make up 5% of U.S. adults, up from 3% a decade ago; and 17% of Americans now describe their religion as “nothing in particular,” up from 12% in 2009. Members of non-Christian religions also have grown modestly as a share of the adult population.
These are among the key findings of a new analysis of trends in the religious composition and churchgoing habits of the American public, based on recent Pew Research Center random-digit-dial (RDD) political polling on the telephone.1 The data shows that the trend toward religious disaffiliation documented in the Center’s 2007 and 2014 Religious Landscape Studies, and before that in major national studies like the General Social Survey (GSS), has continued apace.
Pew Research Center’s 2007 and 2014 Religious Landscape Studies were huge national RDD surveys, each of which included interviews with more than 35,000 respondents who were asked dozens of detailed questions about their religious identities, beliefs and practices. The Center has not yet conducted a third such study, and when the Landscape Study is repeated, it is likely to use new methods that may prevent it from being directly comparable to the previous studies; growing challenges to conducting national surveys by telephone have led the Center to rely increasingly on self-administered surveys conducted online.2
But while no new Religious Landscape Study is available or in the immediate offing, the Center has collected five additional years of data (since the 2014 Landscape Study) from RDD political polls (see detailed tables). The samples from these political polls are not as large as the Landscape Studies (even when all of the political polls conducted in a year are combined), but together, 88 surveys from 2009 to 2019 included interviews with 168,890 Americans.
These surveys do not include nearly as many questions about religion as the Landscape Studies do. However, as part of the demographic battery of questions that ask respondents about their age, race, educational attainment and other background characteristics, each of these political polls also include one basic question about religious identity – “What is your present religion, if any? Are you Protestant, Roman Catholic, Mormon, Orthodox such as Greek or Russian Orthodox, Jewish, Muslim, Buddhist, Hindu, atheist, agnostic, something else, or nothing in particular?”
Additionally, most of these political polls include a question about religious attendance – “Aside from weddings and funerals, how often do you attend religious services? More than once a week, once a week, once or twice a month, a few times a year, seldom, or never?” Taken together, these two questions (one about religious identity, the other about religious attendance) can help shed light on religious trends in the U.S.
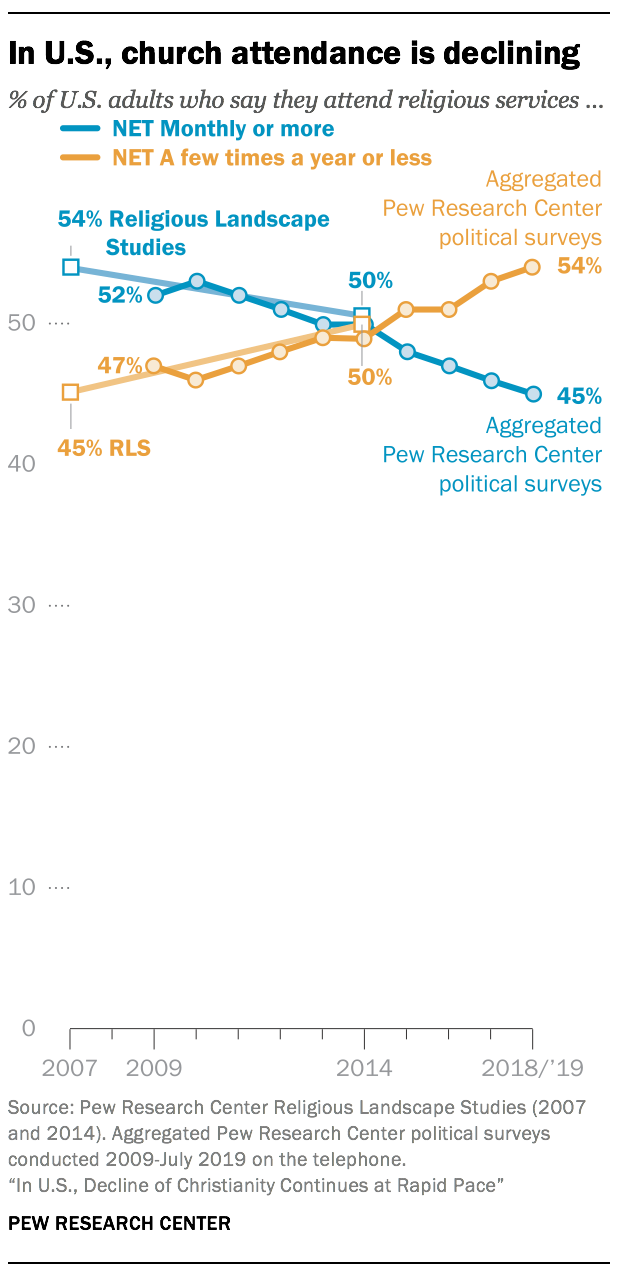
The data shows that just like rates of religious affiliation, rates of religious attendance are declining.3 Over the last decade, the share of Americans who say they attend religious services at least once or twice a month dropped by 7 percentage points, while the share who say they attend religious services less often (if at all) has risen by the same degree. In 2009, regular worship attenders (those who attend religious services at least once or twice a month) outnumbered those who attend services only occasionally or not at all by a 52%-to-47% margin. Today those figures are reversed; more Americans now say they attend religious services a few times a year or less (54%) than say they attend at least monthly (45%).
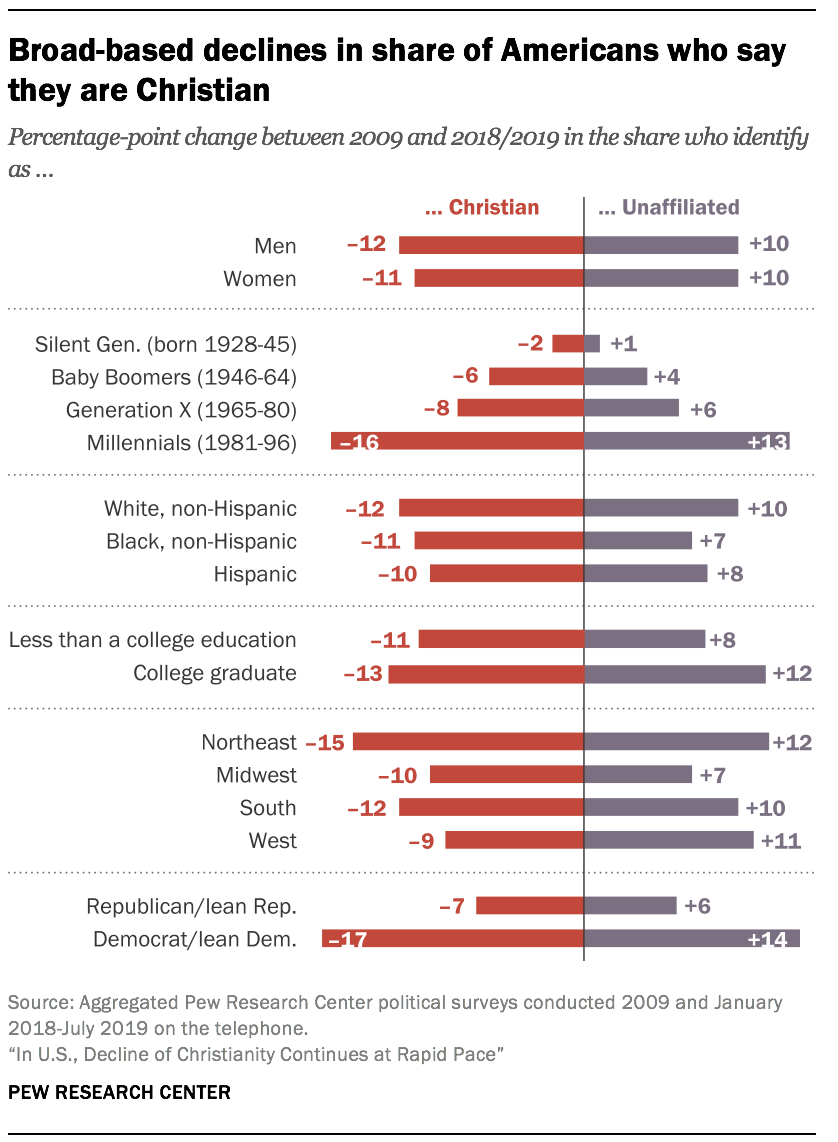
The changes underway in the American religious landscape are broad-based. The Christian share of the population is down and religious “nones” have grown across multiple demographic groups: white people, black people and Hispanics; men and women; in all regions of the country; and among college graduates and those with lower levels of educational attainment. Religious “nones” are growing faster among Democrats than Republicans, though their ranks are swelling in both partisan coalitions. And although the religiously unaffiliated are on the rise among younger people and most groups of older adults, their growth is most pronounced among young adults.
Furthermore, the data shows a wide gap between older Americans (Baby Boomers and members of the Silent Generation) and Millennials in their levels of religious affiliation and attendance. More than eight-in-ten members of the Silent Generation (those born between 1928 and 1945) describe themselves as Christians (84%), as do three-quarters of Baby Boomers (76%). In stark contrast, only half of Millennials (49%) describe themselves as Christians; four-in-ten are religious “nones,” and one-in-ten Millennials identify with non-Christian faiths.
Only about one-in-three Millennials say they attend religious services at least once or twice a month. Roughly two-thirds of Millennials (64%) attend worship services a few times a year or less often, including about four-in-ten who say they seldom or never go. Indeed, there are as many Millennials who say they “never” attend religious services (22%) as there are who say they go at least once a week (22%).


